
Reducing urban water pollution with water level sensors
Urban storm water drain pollution can increase during dry weather and become an environmental problem. Water level in drains increases because of transient sources such as over-irrigation of gardens, car washing, cleaning of footpaths, as well as constantly-flowing sources such as groundwater infiltration and broken underground pipes. This is known as dry-weather flow, or non-stormwater flow, and the water can carry significant amounts of bacteria and other pollutants. These contaminants are then washed into rivers, estuaries and oceans causing pollution.
Dry-weather flow is concerning to San Diego County, USA, because the sensitive and diverse marine environment off the coast can be impacted. Hydraulic engineers in San Diego implemented a monitoring program that used HYDROS 21 water level sensors, and ZL6 data loggers, to monitor water level and drainage across 80 drains. Monitoring was conducted in near-real time with internet access to the data via the ZENTRA Cloud online platform. By monitoring near-real time water level, the engineers in San Diego County could implement management and education strategies to reduce flows and subsequent pollution.
This article was originally posted on the METER Group website where they continue to discuss how the HYDROS 21 water level sensor and ZL6 data logger were used for urban water drainage monitoring.
dry-weather monitoring in San Diego County, USA
San Diego County, the second most populous county in California, is flanked by more than 70 miles of coastline and some of the most beautiful aquatic recreational sites in the United States. The County of San Diego is one of multiple San Diego Regional Municipal Separate Storm Sewer System (MS4) Permit* Copermittees responsible for protecting water quality along the coastline that can be impacted by non-stormwater or “dry weather” flows through the storm drain network. To protect these water bodies, the County of San Diego has partnered with engineering and consulting firms such as Wood Environment and Infrastructure, Inc. (Wood) to execute a flow-monitoring program that identifies transient high flow events and tracks dry-weather flow reductions from year to year. Since 2017 Wood has been using METER data loggers and water level sensors to deliver high quality flow data to meet the program needs.
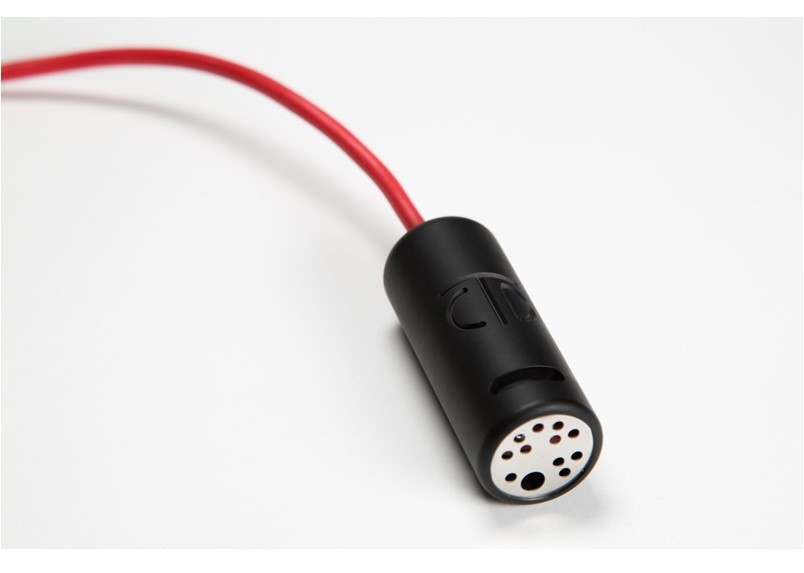
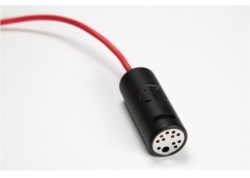
Figure 1. METER HYDROS 21 water level sensor.
flow data in near-real time
Dry-weather flow, or “non-stormwater flow”, is any water entering the MS4 on a typical day without precipitation**. Dry-weather flow can carry bacteria and other pollutants and is caused by transient sources such as over-irrigation, draining a pool, car washing and illegal sewage dumping as well as constantly-flowing sources such as groundwater infiltration and broken underground pipes. Neil Searing, Land Use/Environmental Planner for the County of San Diego says, “One of our main goals is to reduce pollutants through the reduction of non-stormwater flows through our MS4 permit. We need to measure those goals, and that’s where the monitoring program comes into place. We need a way to quantify flow reductions to see if our strategies are successful.”
The County of San Diego monitors approximately 80-90 MS4 outfalls annually for dry weather flows from May to October. The main approach used at most sites combines a v-notch weir, METER’s HYDROS 21 sensor (water level, temperature and electrical conductivity), and a cloud-connected data logger. The logger passes information to a data management software called ZENTRA Cloud that enables users to see data remotely in near-real time.
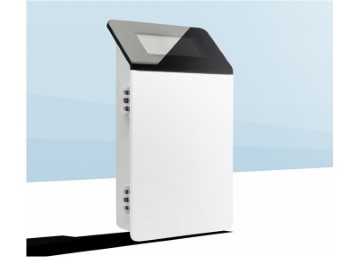
Figure 2. METER cloud-connected data logger (ZL6).
Once anomalous or elevated flows are identified, County of San Diego and Wood personnel conduct outreach and education to reduce these flow sources. Seeing the data in near-real time allows for high flow detection, rapid decision-making, and data-driven management. Jeremy Burns and Alex Messina are environmental scientists at Wood leading the technical and data analysis aspects of the flow monitoring program. Burns explains, “San Diego’s water quality improvement plan (WQIP) is working toward achieving different regulatory goals for compliance with their NPDES permit. One of these targets is a percent reduction of dry weather flow over time. They are tracking dry weather flows at a host of sites to see if management actions have been effective. They use the flow data we collect to discover potential problems. For example, when we see recurring periods of spikes in flow, the County of San Diego will go out and observe the site. They may find a broken sprinkler that is flowing into the storm drain and ask the residents to repair it.”
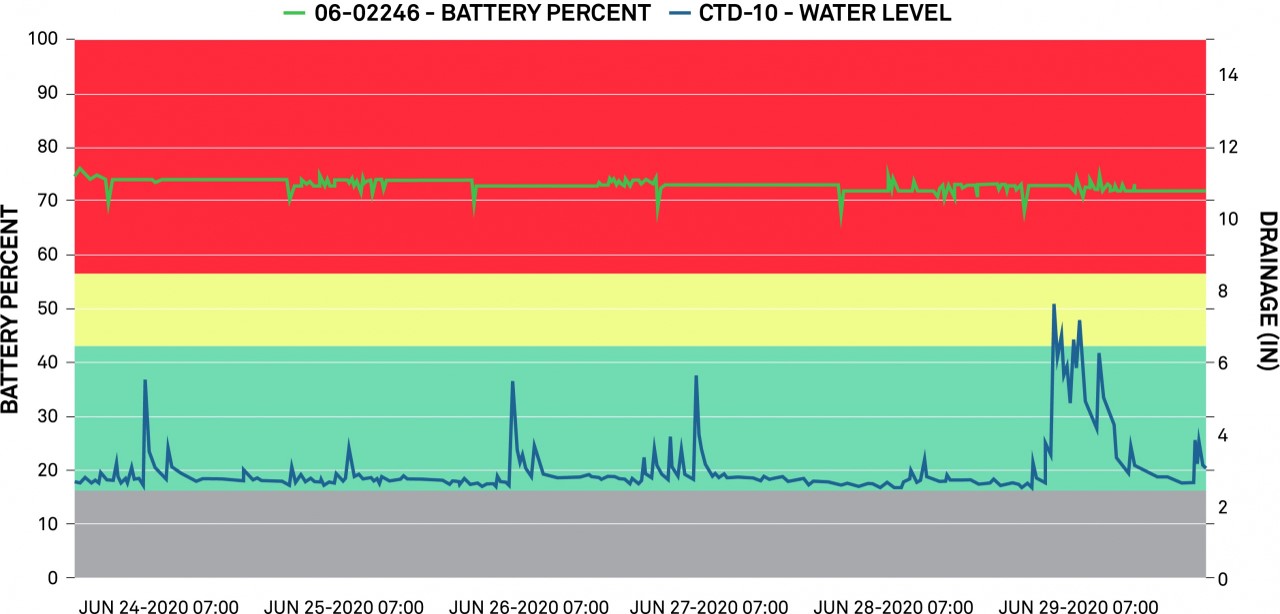
Figure 3. HYDROS 21 (formerly named CTD-10) water level data from a site with regular high flows
Figure 3 is an example of a site with regular high flows likely due to night time over-irrigation. High flows are observed every night around midnight. The “Target Ranges” feature of ZENTRA Cloud allows Wood to set easily-visible thresholds for high flows. The grey is where water level is below the v-notch of the weir (not flowing), green indicates water flowing through the v-notch, yellow indicates water flowing in the rectangular part of the weir, and red indicates the weir is completely submerged. Battery level is also plotted.
how sensitive/accurate are the v-notch weirs?
Messina says the v-notch weir setup is pretty sensitive to changes in flow, even if it’s just a sprinkler going awry. He says, “Generally speaking, it’s easy to see spikes in the data. V-notch weirs are sensitive to very small changes in flow, although it depends how much water is behind the weir. In some areas where the incoming pipe is flat, you could have 50 gallons of water ponded behind the weir. If the flow is a small trickle, it takes a while for the weir pond to fill up. But once that pond is full, it flows right through. In some cases, we’re limited by the infrastructure. We’ll put in a weir, it will back up the water, and then the water just seeps through a crack in the pipe. But in other areas we’ll detect a single sprinkler that went off where the data spikes for five minutes and then goes back down.”
Compared to flow measurements in natural stream channels, using v-notch weirs allows for very high accuracy and low uncertainty. For year to year comparisons, data accuracy must be very high to detect small percentage changes in flows, and the data quality from the weir is directly dependent on the accuracy and reliability of the water level sensor. Using vented water level sensors like the HYDROS 21 removes the uncertainty of performing barometric compensation that would be needed for a non-vented pressure transducer, and it removes a step from data processing to reduce analyst costs. The County of San Diego and Wood conducted a comparison study of different pressure transducers in the lab and at field sites and found the METER HYDROS 21 (formerly named CTD) sensor provided real-world performance of +/-0.1 inch accuracy (Burns, 2019).
combining multiple sources of data
Flow data collected over different years showed variable levels of constant baseflow in many of the MS4 outfalls. The increased baseflow was hypothesized to be caused by higher antecedent, winter rainfall raising the water table and causing infiltration into the MS4. The County of San Diego and Wood conducted a dry-weather flow source tracking study to determine the contributions of tap and groundwater to total flows.
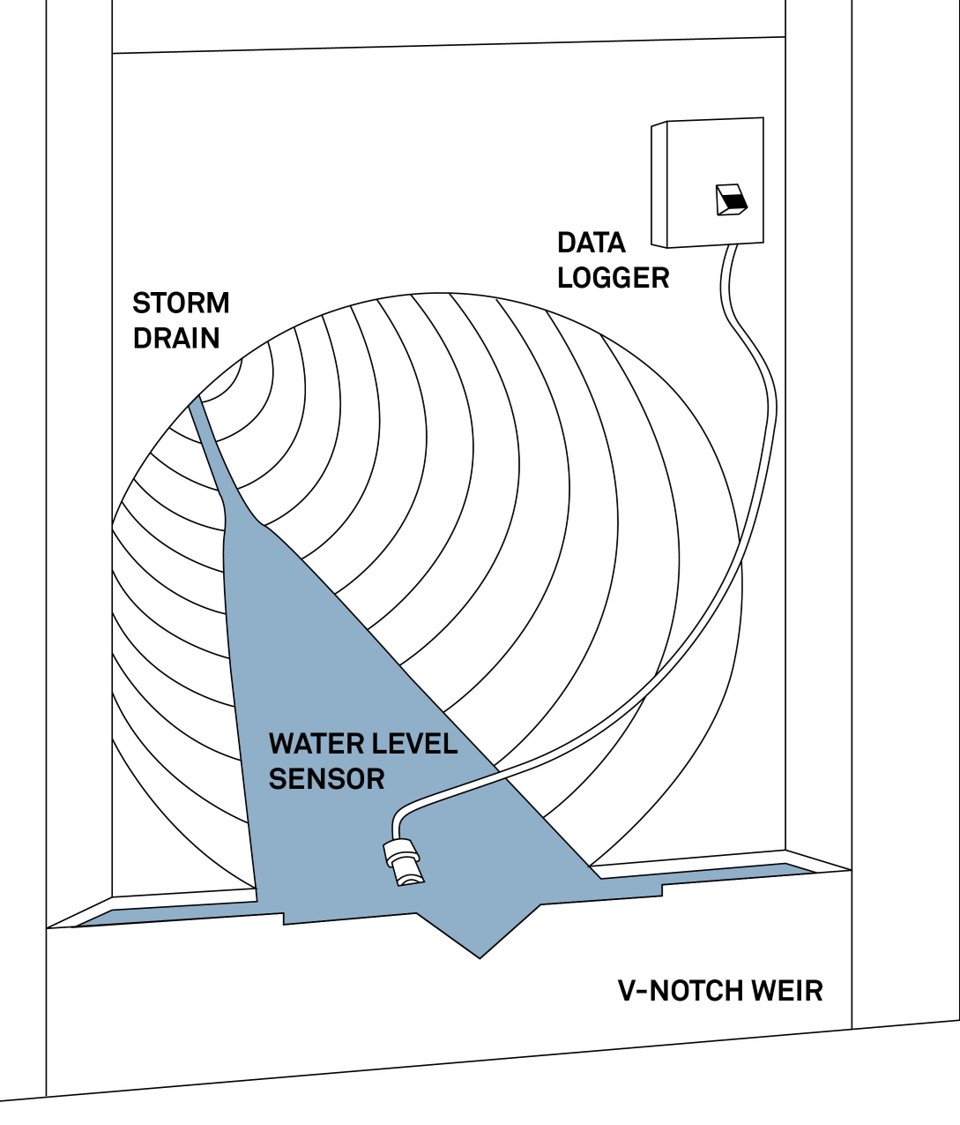
Figure 4. Diagram of a 90 degree v-notch weir setup used for high-accuracy flow measurement. Water level data recorded by METER HYDROS 21 (formerly named CTD) (in white PVC housing) connected to METER telemetry-enabled data logger (in custom stainless steel enclosure box).
Messina says multiple sources of data help identify different sources of dry-weather flow so the County of San Diego can make informed decisions. “We look at flow dynamics, geochemistry, and stable isotopes to see if we can characterize the sources of the water. Stable isotope ratios aren’t changed as the water moves through the watershed and retain the signature of their original flow source (tap water or groundwater), so they’re good reference data. Flow dynamics can then be combined with stable isotope data. For instance, if flow is constant and the isotope data indicates tap water, it’s probably a leaky pipe. If isotopes indicate it’s not tap water, then the constant source is likely groundwater. We also use geochemistry to help us detect specific sources of tap water like reclaimed water used for irrigation. We use other indicators too, like surfactants (MBAS). If we detect surfactants, for example, that would indicate surface runoff from, say, a carwash situation.”
Burns says electrical conductivity data from the HYDROS 21 sensors are also useful. He says, “We used to only measure water level. But one of the benefits of moving to the HYDROS 21 sensor besides affordability and near real-time telemetry, is the conductivity measurement. It added a new facet of data we now analyze. It is particularly useful for seeing if the probe is dry (there’s no water in there at all) or if a high flow shows a change in conductivity, for example due to sparse, localized rain that is undetected by rain gauges. It’s another data point to help us understand if it is a groundwater versus tap water input to the storm drain.”
lessons learned
Messina says over the course of the project they learned that measuring flow in storm drains was more complicated than it at first seemed. He explains, “Even though it’s a ‘low flow’ project, some storm drains aren’t low flow at all. If a fire hydrant breaks or someone drains a pool, it causes a huge change in flow. This wide range of flows is a problem because weirs have a recommended flow target range, meaning some weirs are designed for low flows, and others for high flows. The HYDROS 21 level sensor can accommodate the wide range in water levels we measure behind the weirs. In addition, everyone thinks we’re measuring flow in a sealed system. But it turns out there are many cracks in the pipes where water comes in or out. And, in some cases, flow measurement is complicated by built infrastructure that is not shown on existing maps. A housing project might route a natural creek into a storm drain as the easiest place to manage the water flowing through the development. So we’re measuring a mix of natural and human-built systems, which is way more complex than we initially realized.”
Messina adds that understanding flow data and dry weather flow sources can be complicated. He says, “There are confounding factors. For instance: if we get more or less rain in a year, are the groundwater tables influencing the flows we’re seeing? Also, when your absolute differences are small, your relative difference (or percent difference) can be really high, and that may not be informative. For example, if the flow rate went from 0.1 to 0.2 gallons a day at a single site, it would be a 100% difference. Just because there is a seemingly large percent change, it may not be something the County of San Diego needs to dump resources into addressing.”
program successes
About the success of the County of San Diego’s water quality improvement program in general, Burns says, “I think we’ve done a good job explaining the complexities of what they’re dealing with. And I think it’s been helpful.” The flow data have been used to convince stakeholders to institute Best Management Practices like adding vegetative buffers and conversion to drought-tolerant landscaping to control over-irrigation. Flow data collected the following year then showed these efforts successfully reduced flows in the downstream storm drains (Wisniewska and Messina, 2019).
the future of the project
Non-stormwater reduction requirements in the MS4 Permit will continue requiring the regional copermittees to engage in education and outreach and monitor MS4 flow to assess achievement of WQIP goals. Although it would be beneficial for the regional parties to follow a similar approach to flow monitoring, there are a variety of methods that can be employed. This paper briefly describes many of the challenges for low-flow monitoring and an accurate approach using custom weirs with METER HYDROS 21 sensors and cloud-connected data loggers. One of the primary benefits of near real-time data is the ability to see data anomalies and respond quickly.
At METER, the capabilities of ZENTRA Cloud are continuously being improved through real-world project collaboration with groups like the County of San Diego and Wood. Some future improvements include programming of primary flow devices to see real-time flow values rather than only level; multiple alarm thresholds that address a variety or combination of parameters; and SMS and email notifications to groups or individuals. Notifications allow teams to be highly responsive to environmental conditions and, ideally, improve the ability to observe flow sources and remedy in a timely fashion. While agencies continue to chase challenging and often fleeting flow sources, having nimble, affordable, and user-friendly access to reliable data is a key ally to achieving flow-reduction goals.
references:
Burns, Jeremy. 2019. “How Accurate are My Flow Data? Water Level Sensor Evaluation to Assess Confidence in Compliance Assessments” California Stormwater Quality Association (CASQA) Annual Conference. October 2019.
Wisniewska, Joanna, and Messina, Alex. 2019 “Flow Source Forensics: Using Multiple Lines of Evidence to Identify and Quantify Dry-Weather Flow Sources”. CASQA) Annual Conference. October 2019.