calibration of the SF-4/5 micro stem sap flow sensor
Author:
Michael A. Forster PhD
Director, Edaphic Scientific Pty Ltd
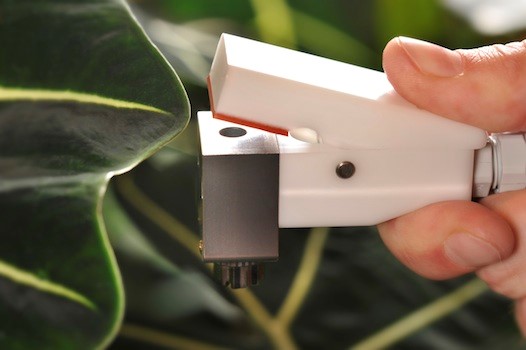
The SF-4/5 Micro Stem Sap Flow Sensor (Figure 1), manufactured by Phyto-Sensor Group, is designed to measure sap flow and water use in stems from 2 to 10 mm in diameter. The sensor can be installed on any conducting plant tissue such as woody stems, petioles or fruit peduncles.
Due to its ease of installation and low maintenance requirements, the SF-4/5 has significant potential to improve sap flow measurements for researchers and growers.
The output provided by the SF-4/5 sensor is a raw value expressed as millivolt (mV). But does the mV output correlate with the water use of a plant?
Figure 2 shows the correlation between a SF-4 Micro Stem Sap Flow Sensor installed on a Hakea salicifolia (Willow-leaved Hakea), that had 3.1 mm diameter, and stomatal conductance measured with the SC-1 Leaf Porometer.
The x-axis displays the mV output from the SF-4 sensor and the y-axis displays stomatal conductance. The correlation between the SF-4 sap flow sensor and the independent measure of water use is highly significant (R2 = 0.95) indicating that the SF-4 sensor can precisely measure plant water use.

Figure 2. An example of correlation data between the SF-4 Micro Stem Sap Flow Sensor and the SC-1 Leaf Porometer measured on a 30cm tall Hakea sapling (R2 = 0.95, p < 0.001).
how to calibrate the SF-4/5 sap flow sensor

Figure 3. After carefully installing the SF-4 sensor on the target stem, wrap the sensor in aluminium foil.
The output from the SF-4/5 Micro Stem Sap Flow Sensor is linear. Therefore, to calibrate the SF-4/5 sensor it is necessary to correlate the millivolt data against a range of water use data from zero to high flow.
The range in values can be measured over the course of a day where there is zero to low flow during the night and increasing rates of flow during the daytime.
An independent measure of water use, such as a leaf porometer, weighing lysimeter, or growth chamber, is also required.
The following example is a calibration of the SF-4/5 sensor against stomatal conductance. The same procedure can be used with other independent measures of water use.
Materials
- SF-4/5 Micro Stem Sap Flow Sensor
- Plant Specimen
- Aluminium Foil
Method
Step 1:
Install the SF-4/5 sensor on the stem according to the manual. Insulate the sensor with the aluminium foil. Connect the sensor to the data logger. Record data at high frequency intervals (at least every 5 minutes).
Step 2:
Set up the SC-1 Leaf Porometer according to the manual. Ensure the instrument is calibrated according to the manual.
Step 3:
Make the first measurement at pre-dawn. Measure at least 3 leaves, selected randomly, distal to the SF-4/5 sensor, with the SC-1 Leaf Porometer and take the average.
Step 4:
Continue to measure the plant with the SC-1 Leaf Porometer throughout the day at periodic intervals. Hourly intervals are recommended. Continue periodic measurements until after sunset or until the stomatal conductance values have stabilised at a low value. (Note: the SC-1 will never measure a zero value. A value around 15 to 25 mmol/m-2/s-1 is considered a “zero value”. There will always be some conductance due to stomatal and cuticle leakage).
Step 5:
With the SF-4/5 data, find the lowest value and mark this as the zero value. The zero value should occur during the night-time when there is little, or zero, sap flow. Adjust all other data against the zero value. For example, if the lowest value from a day is 378 mV, then subtract 378 from this value to give 0 mV. Then, for all other data, subtract 378 mV.
Step 6:
Compare the adjusted SF-4/5 mV output data against the SC-1 stomatal conductance data. Apply a linear regression curve to the data and note the linear equation. This equation is the calibration equation that can be applied to subsequent days of measurement.
Important Note
A calibration curve must be created for different species or varieties. The calibration is not calibrating the sensor, per se, rather how the heat dynamics from the SF-4/5 sensor interacts with the plant tissue and sap flow of the target plant specimen.
calibration curves and different species
Figure 5 shows calibration data from three different species: Hakea salicifolia (a woody shrub species from warm temperate forests); Ardisia humilis (Coral Berry, a woody shrub species from tropical rainforests); and Fragaria sp. (Strawberry, Red Gauntlet, an herbaceous horticultural variety).
Note the slope of the curve differs for the different species.

Figure 5. The calibration slopes for three different species. Blue circles: Hakea (R2 = 0.90, p < 0.05); Red circles: Ardisia (R2 = 0.76, p < 0.05); Pink circles: Fragaria (R2 = 0.82, p < 0.05).
calibration curves on subsequent days
Figure 6 shows the calibration curves from subsequent days for Hakea and Ardisia. Note that the slope of the curves, for each species, was not significantly different on the subsequent days.

Figure 6. Closed circles (day one) and open circles (day two) indicate that calibration curves across subsequent days, for the same species, are similar.
diurnal SF-4 and stomatal conductance curves
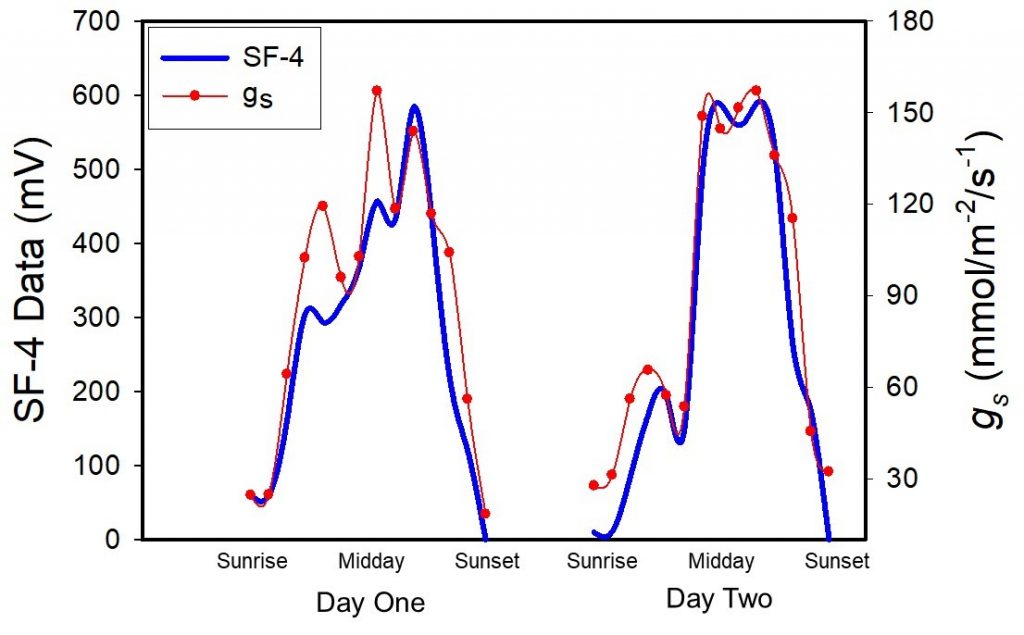
Figure 7 shows the time course, over several days, of SF-4 mV data and SC-1 stomatal conductance data for Ardisia.

Figure 7. The time course, over two subsequent days, of SF-4 (blue) and stomatal conductance (red) data. The data are not presented in comparable units so the curves should not overlap. However, the direction and magnitude of response is similar.
a comparison of raw, relative and absolute data
The following figures show the raw (mV) data (Figure 8), relative (%) data (Figure 9), and absolute (mmol/m-2/s-1) data (Figure 10), measured from the three species over a one-day period.


